< Back


Download PDF
Summary
- Benchmark treasury yields rose across the curve due to higher-than-expected inflation and continued robust economic activity
- The Fed raised short-term policy rates by another 0.75% in response, and Fed officials continued to communicate an aggressive resolve to fight inflation
- Stocks and bonds declined accordingly, with the S&P 500 Index closing September below June lows and the bond market continuing a historic decline in price
- Municipal bonds outperformed government and corporate bonds, as limited new issuance and strong credit performance supported their returns
- Year-to-date returns for major market indices:
- S&P 500: -23.9%
- S&P 500: -23.9%
- Bloomberg Aggregate Bond Index: -14.6%
- Bloomberg Corporate Bond Index: -18.7%
- Bloomberg Municipal Bond Index: -12.1%
Market Review
Investors’ anticipations of a softer monetary policy pivot from the Federal Reserve were quelched in September as August Consumer Price Index (CPI) inflation data came in hotter than expected, rising to 0.1% month-over-month and 8.3% year-over-year1. In addition to higher-than-expected inflation, economic activity remained robust, with producer price inflation, retail sales, jobless claims, and housing starts all exceeding expectations, and 2021 gross domestic product (GDP) being revised from 5.7% to 5.9%2. In response to higher inflation and strong economic fundamentals, the Federal Reserve raised short-term policy rates by another 0.75%, bringing the Fed Funds rate to the highest level since 2007, at 3.25%. Throughout the month, Fed officials continued to re-affirm verbal commitments to fight inflation by any means necessary, with Federal Open Market Committee (FOMC) members projecting a Fed Funds rate of 4.375% by year end and 4.625% next year.
The benchmark 10-year Treasury yield rose to a decade-high of 3.95%, before ending the quarter at 3.83%. Rising rates drove losses of the Aggregate Bond Index to -14.6% for the year, over four times worse than the worst previous calendar year on record.


Despite strong trailing economic data, concerns that aggressive monetary tightening would push the economy into recession led risk assets to continue their decline from the previous month. Fears of recession drove the inversion between 2-year and 10-year treasuries to year-to-date lows of -53 basis points (bps) in late September, before ending the month at -45 bps.

Equities (as measured by the S&P 500) declined by -9.2%, bringing year-to-date returns to negative 23.9%. Investment grade credit spreads widened to +188 bps, and high yield credit spread widened to +539 bps. Although municipal bond returns were hampered by rising benchmark rates, municipal spreads remained relatively tight, with 5-year AAA munis widening from 71% of treasury to 76% of treasury.
U.S. assets continued to outperform versus their international counterparts in both equities and fixed income. In particular, U.K. government bonds (“gilts”) suffered a significant shock late in the month due to a significant increase in U.K. debt issuance alongside rapid deleveraging of liability-driven investment strategies. Britain’s new finance minister Krasi Kwarteng announced historic tax cuts for individuals and corporations, projecting over $69 billion of debt issuance to support deficit spending. The significant projected increase in the deficit led investors to sell U.K. government bonds, causing the cost of borrowing to increase by the largest one-day rise since 1991, and the pound to decrease to near parity with the dollar – levels last seen over 37 years ago.
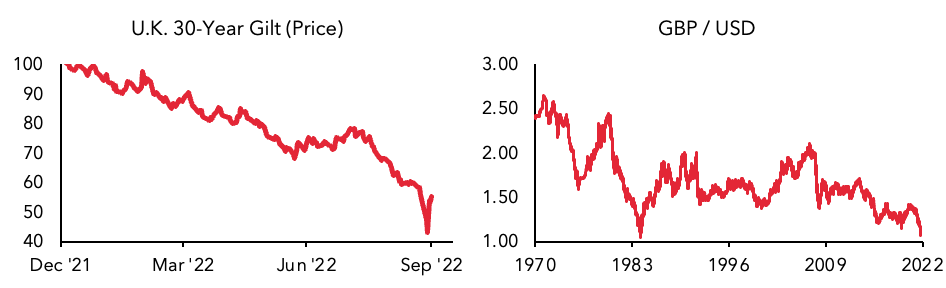
The timing of the announcement compounded investor concerns that Truss’ government was losing financial credibility, as just a day before the Bank of England hiked interest rates in an attempt to contain surging inflation. The selloff in long-dated bonds began to compound, as the decline in bond prices forced highly leveraged liability-driven investment programs to sell securities to meet margin calls. Benchmark 30-year U.K. government bonds sold off to a low of -61.1% below their prior peak before the Bank of England intervened by announcing unlimited purchases of long-dated bonds to stabilize the market.
Turmoil in the bond markets has begun to present compelling opportunities for long-term investors focused on quality securities. For the first time in many years, investor compensation for owning fixed income assets has steadily begun to rise. 10-year Treasury Inflation Protected Securities (TIPS) closed the quarter with a yield of 1.67%, rebounding significantly from the 2021 low of -1.20%. Corporate interest coverage ratios remain near all-time highs, yet investment-grade U.S. corporate bonds now yield 5.7%3. High-yield bonds have begun to live up to their name, now yielding 9.7%4. Investment-grade tax-exempt municipal bond yields have increased to 4.05% , while California tax-exempt municipal bond yields have increased to 3.8%6. Assuming a federal tax rate of 40.8% and California state tax rate of 12.3%, tax-equivalent yields for national municipal bonds stands at 6.8%, and tax-equivalent yields for California municipal bonds stands at 8.2%.

1U.S. Bureau of Labor Statistics, 9/13/22
2U.S. Department of Commerce Bureau of Economic Analysis (BEA), 9/29/22
3Refers to Bloomberg U.S. Corporate Bond Index, 9/30/22
4Refers to Bloomberg U.S. Corporate Bond High Yield Index, 9/30/22
5Refers to Bloomberg Municipal Bond Index, 9/30/226Refers to Bloomberg California Municipal Bond Index, 9/30/22
Mutual fund investing involves risk. Principal loss is possible. Fixed income investments are subject to interest rate risk, and their value will decline as interest rates rise. Investments in fixed income securities are subject to the risks associated with debt securities generally, including credit, liquidity and interest rate risk.
Investors should consider the investment objectives, risks, charges and expenses carefully before investing. For a prospectus or summary prospectus with this and other information about the Fund, please call 833-996-2101 or visit our website at AmbrusFunds.com. Read the prospectus or summary prospectus carefully before investing.
The Ambrus Funds are distributed by Foreside Funds Distributors, LLC.
Index Definitions
The S&P 500 Index is a market-capitalization-weighted index of 500 leading publicly traded companies in the U.S. Bloomberg Aggregate Bond Index is a broad-based flagship benchmark that measures the investment grade, US dollar-denominated, fixed-rate taxable bond market. The index includes Treasuries, government-related and corporate securities, MBS (agency fixed-rate pass-throughs), ABS and CMBS (agency and non-agency). The Bloomberg U.S. Corporate Bond Index measures the investment grade, fixed-rate, taxable corporate bond market. It includes USD denominated securities publicly issued by US and non-US industrial, utility and financial issuers. The Bloomberg U.S. Corporate High Yield Bond Index measures the USD-denominated, high yield, fixed-rate corporate bond market. Securities are classified as high yield if the middle rating of Moody’s, Fitch and S&P is Ba1/BB+/BB+ or below. The Bloomberg Municipal Bond Index consists of a broad selection of investment-grade general obligation and revenue bonds of maturities ranging from one year to 30 years. It is an unmanaged index representative of the tax-exempt bond market, made up of all investment grade municipal bonds having a remaining maturity of at least one year. The Bloomberg California Municipal Bond Index is a subset of the Municipal Bond Index, which only includes municipal bonds from issuers in the state of California. Indexes are unmanaged, do not incur management fees, costs, and expenses, and it is not possible to invest directly in an index. Index performance is not indicative of fund performance. Past performance is no guarantee of future results.
Glossary
Basis point (bp): one hundredth of one percent. Yield to Worst (YTW), also known as Effective Yield, refers to the lowest potential yield that can be received on a bond without the issuer defaulting. The YTW is calculated by making worst-case scenario assumptions on the issue by calculating the return that would be received if the issuer uses provisions, including prepayments. Taxable-Equivalent Yield (TEY) is the return that a taxable bond would need to equal the yield on a comparable tax-exempt municipal bond. The calculation is a tool that investors can use to compare the returns between a tax-free investment and a taxable alternative. Consumer Price Index (CPI) measures the overall change in consumer prices based on a representative basket of goods and services over time.
Credit Quality Rating Disclosures
Bond ratings are grades given to bonds that indicate their credit quality as determined by private independent rating services such as Standard & Poor’s, Moody’s and Fitch. These firms evaluate a bond issuer’s financial strength, or its ability to pay a bond’s principal and interest in a timely fashion. Ratings are expressed as letters ranging from ‘AAA’, which is the highest grade, to ‘D’, which is the lowest grade.