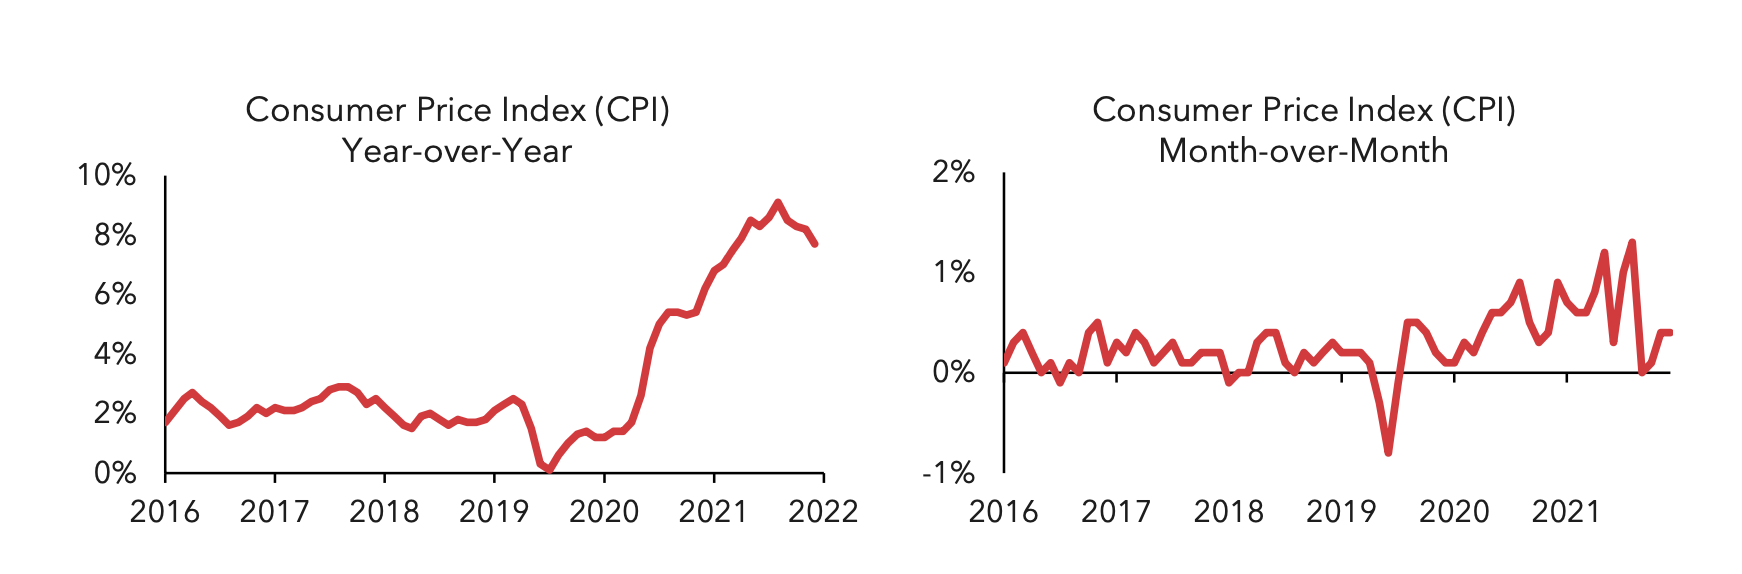
Inflation cooled versus market expectations, with the Consumer Price Index (CPI) decelerating to 0.4% month-over-month / 7.7% year-over-year
Markets rallied in anticipation of slowing inflation, with both stocks and bonds rebounding from October lows
The Federal Reserve raised the short-term Fed Funds rate by 75 basis points (bps) to 4%, the highest level since January 2008
Year-to-date returns for major market indices:
S&P 500: -13.1%%
Bloomberg Aggregate Bond Index: -12.6%
Bloomberg Corporate Bond Index: -15.4%
Bloomberg Municipal Bond Index: -8.8%
Market Review
In a reprieve from the summer months, financial markets experienced strong performance throughout November as both trailing and leading indicators of inflation began to moderate. In response to moderating inflation, bond yields declined precipitously, with the 10-year U.S. Treasury yield declining from a high of 4.2% to 3.6%, driving month-to-date performance of the Aggregate Bond Index to 3.7%. Returns for both stocks and bonds remained positively correlated, with the S&P 500 Index gaining 5.6% on the back of slowing inflation.
The Consumer Price Index (CPI) rose by 7.7%, which was both less than the market expected (7.9%) and less than the previous month (8.2%)1. On a month-over-month basis, CPI rose by 0.40%. Excluding the more volatile food and energy components, Core CPI increased by only 6.3%. The Producer Price Index, a measure of inflation tracking producer’s input inflation, also decelerated month over month and was less than market expectations1.
The deceleration in inflation was particularly pronounced in goods, especially those that were most responsible for contributions to overall inflation when inflation began to take hold last year. Decelerating consumer spending and rising retailer inventory levels also led to apparel prices continuing their decline from the previous month. Wholesale inventory levels continued to rise, increasing the likelihood that goods inflation continues to decelerate throughout the remainder of the year.
Although many inflation measures began to decline, the Federal Reserve (Fed) proceeded to raise short-term interest rates (the Fed Funds rate) by 75 basis points (bps), to 4.0%. Market reaction to the increase in policy rates was muted, as the increase was in-line with expectations of both the futures market, economists, and Fed officials.
In a reversal of multiple months of hawkish communications, Fed chair Jay Powell acknowledged that inflation pressures were easing, and thus it may be appropriate to slow the pace of rate increases over the coming months.
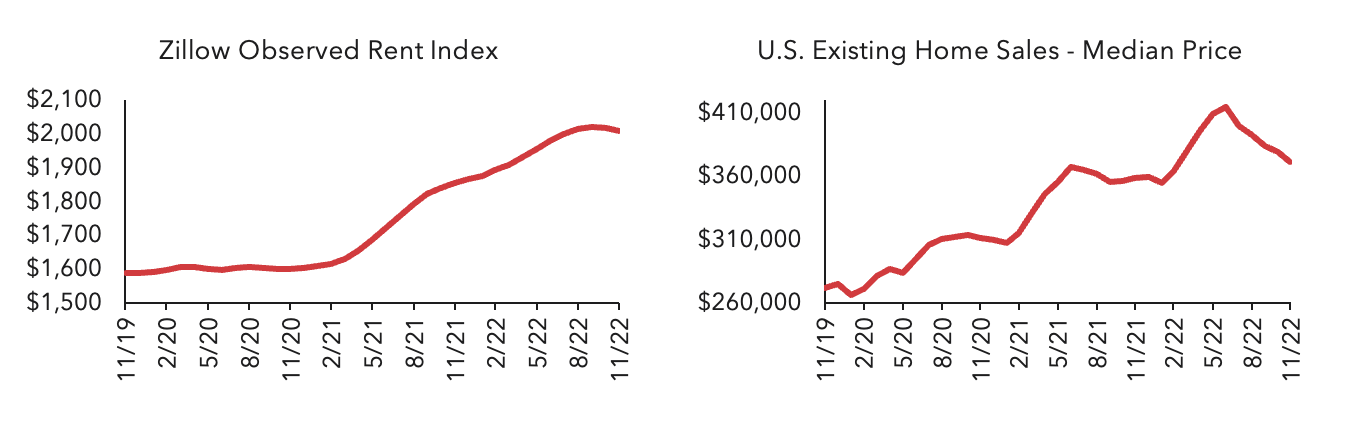
Fed officials remained concerned about ongoing inflation in the services sector, which primarily includes wages and housing. Wage inflation remained stubbornly entrenched as the labor market strength persisted, with initial jobless claims, nonfarm payrolls, and average hourly earnings all exceeding expectations. The Fed acknowledged that although October’s CPI report reflected an acceleration of shelter costs, this does not provide a real-time measure of the state of the housing market. Other indicators confirmed an ongoing slowdown in both owner-occupied and renter-occupied real estate, with new housing starts declining -4.2%2 and existing home sales volume declining -5.9%3 month-over-month. Existing home sales prices also continued to decline from a peak of $413,800 in June to $370,700 at the end of November3. The Zillow Observed Rent Index, a real-time measure of new leasing activity, decelerated from a peak of 17% year-over-year in February to 8.7% in November. As a measure of new leases, this index tends to lead CPI shelter costs, given the lag between new leases coming to market at lower prices versus new leases being signed (and subsequently being reflected in CPI data).
Interest rate futures reacted to slowing inflation, reducing the path of projected Fed rate hikes and the projected terminal Fed Funds rate. By the end of the month, the futures market reflected approximately four additional 25 basis point Fed Funds rate hikes, bringing the implied terminal Fed Funds rate to 4.92% in May 2023. Markets also expect a rapid Fed pivot, with rate cuts beginning as soon as July 2023. The decline in interest rates was driven by falling real yields, with inflation-indexed 10-year Treasury yields declining from a high of 1.75% to 1.24%. Long-term inflation expectations also declined, with 5-year 5-year forward breakeven inflation rates4 declining from 2.33% to 2.22%.
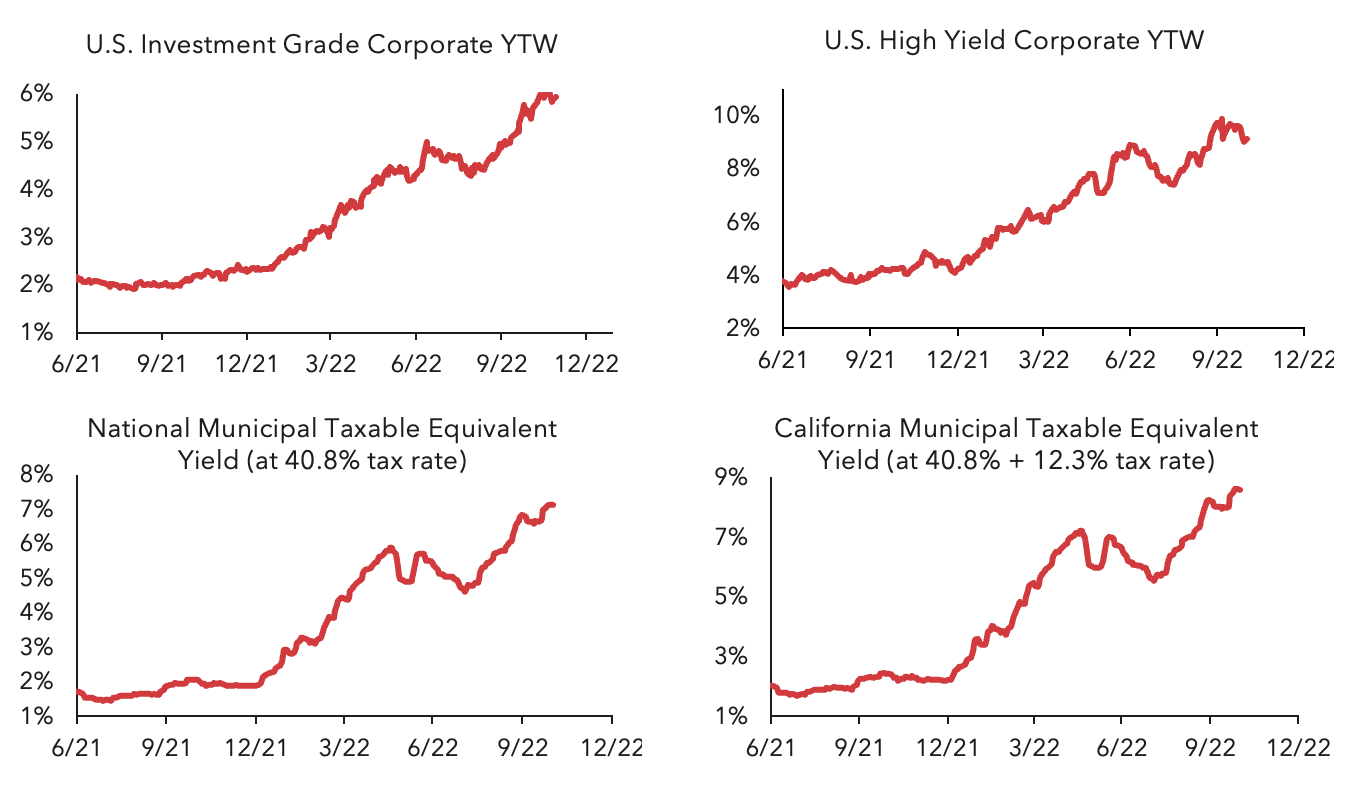
Municipal bonds lead fixed income market performance in November, driven by historically low issuance. New municipal bond issuance totaled less than $20 billion, the lowest month of the year. Municipal bond ratios as a percentage of treasuries also declined, with 5-year municipal bonds yielding 70.8% of treasuries at month end. The yield of the Bloomberg Municipal Bond Index declined to 3.54%, while the yield of the Bloomberg California Municipal Bond Index declined to 3.34%. Taxable municipal bond spreads5 also narrowed, declining to +134 basis points (bps).
Investment grade corporate bond spreads6 narrowed to +163 bps, driven by both low new issuance supply as well as positive third-quarter earnings releases. High yield corporate bond spreads7 remained stable, ending the month 2 bps tighter at +474 bps. The overall yield to worst (YTW) of investment grade bonds6 declined to 5.31%, and the YTW of high yield bonds7 declined to 8.63%. In the securitized markets, residential agency fixed-rate MBS spreads8 declined from +73 bps to +52 bps, while CMBS spreads9 tightened from +133 bps to +128 bps.
1Bureau of Labor Statistics
2U.S. Census Bureau
3National Association of Realtors
4A measure of the expected inflation rate (on average) over the five-year period that begins five-years from today
5Bloomberg Taxable Municipal Bond Index
6Bloomberg U.S. Corporate Bond Index
7Bloomberg U.S. Corporate High Yield Bond Index
8Bloomberg U.S. MBS Index
9Bloomberg U.S. CMBS ERISA Eligible Index
Mutual fund investing involves risk. Principal loss is possible. Fixed income investments are subject to interest rate risk, and their value will decline as interest rates rise. Investments in fixed income securities are subject to the risks associated with debt securities generally, including credit, liquidity and interest rate risk.
Investors should consider the investment objectives, risks, charges and expenses carefully before investing. For a prospectus or summary prospectus with this and other information about the Ambrus mutual funds, please call 833-996-2101 or visit our website at AmbrusFunds.com. Read the prospectus or summary prospectus carefully before investing.
The Ambrus Funds are distributed by Foreside Funds Distributors, LLC.
Index Definitions The S&P 500 Index is a market-capitalization-weighted index of 500 leading publicly traded companies in the U.S. Bloomberg Aggregate Bond Index is a broad-based flagship benchmark that measures the investment grade, US dollar-denominated, fixed-rate taxable bond market. The index includes Treasuries, government-related and corporate securities, MBS (agency fixed-rate pass-throughs), ABS and CMBS (agency and non-agency). The Bloomberg U.S. Corporate Bond Index measures the investment grade, fixed-rate, taxable corporate bond market. It includes USD denominated securities publicly issued by US and non-US industrial, utility and financial issuers. The Bloomberg U.S. Corporate High Yield Bond Index measures the USD-denominated, high yield, fixed-rate corporate bond market. Securities are classified as high yield if the middle rating of Moody’s, Fitch and S&P is Ba1/BB+/BB+ or below. The Bloomberg Municipal Bond Index consists of a broad selection of investment-grade general obligation and revenue bonds of maturities ranging from one year to 30 years. It is an unmanaged index representative of the tax-exempt bond market, made up of all investment grade municipal bonds having a remaining maturity of at least one year. The Bloomberg California Municipal Bond Index is a subset of the Municipal Bond Index, which only includes municipal bonds from issuers in the state of California. The Bloomberg Taxable Municipal Bond Index consists of a broad selection of investment grade taxable municipal bonds. The Bloomberg US Mortgage Backed Securities (MBS) Index tracks fixed-rate agency mortgage backed pass-through securities guaranteed by Ginnie Mae (GNMA), Fannie Mae (FNMA), and Freddie Mac (FHLMC). The index is constructed by grouping individual TBA-deliverable MBS pools into aggregates or generics based on program, coupon and vintage. The Bloomberg US CMBS Index measures the investment-grade market of US Agency and US Non-Agency conduit and fusion CMBS deals with a minimum current deal size of $300mn that are ERISA eligible. Indexes are unmanaged, do not incur management fees, costs, and expenses, and it is not possible to invest directly in an index. Index performance is not indicative of fund performance. Past performance is no guarantee of future results.
Glossary Basis point (bp): one hundredth of one percent. Yield to Worst (YTW), also known as Effective Yield, refers to the lowest potential yield that can be received on a bond without the issuer defaulting. The YTW is calculated by making worst-case scenario assumptions on the issue by calculating the return that would be received if the issuer uses provisions, including prepayments. Taxable-Equivalent Yield (TEY) is the return that a taxable bond would need to equal the yield on a comparable tax-exempt municipal bond. Credit spread: also known as bond spread, or spread, measures the difference in yield between a debt security and a U.S. treasury bond of the same maturity to allow for a comparison between a bond and a risk-free (U.S. treasury) alternative. The calculation is a tool that investors can use to compare the returns between a tax-free investment and a taxable alternative. Consumer Price Index (CPI) measures the overall change in consumer prices based on a representative basket of goods and services over time. Producer Price Index (PPI) measures the average change over time in the selling prices received by domestic producers for their output.
Credit Quality Rating Disclosures Bond ratings are grades given to bonds that indicate their credit quality as determined by private independent rating services such as Standard & Poor’s, Moody’s and Fitch. These firms evaluate a bond issuer’s financial strength, or its ability to pay a bond’s principal and interest in a timely fashion.
The views and opinions contained herein are those of the author(s) on this page, and may not necessarily represent views expressed or reflected in other Ambrus Funds communications, strategies or funds. This material is intended to be for information purposes only and is not intended as promotional material in any respect. The material is not intended as an offer or solicitation for the purchase or sale of any financial instrument. It is not intended to provide and should not be relied on for accounting, legal or tax advice, or investment recommendations. Reliance should not be placed on the views and information in this document when taking individual investment and/or strategic decisions.