Credit markets and interest rates were roiled by the collapse of Silicon Valley Bank and Signature Bank, leading to contagion concerns in other regional banks
The Federal Reserve (Fed) launched emergency liquidity programs, with the Fed’s balance sheet expanding from $8.34tn to $8.73tn
Inflation continued to moderate, and the Fed signaled that interest rate hikes may be close to pausing
Year-to-date returns for major market indices:
S&P 500: 7.48%
Bloomberg Aggregate Bond Index: 2.96%
Bloomberg Corporate Bond Index: 3.50%
Bloomberg Municipal Bond Index: 2.78%
Market Review
Financial market volatility spiked in the month of March by the sudden collapse of Silicon Valley Bank and Signature Bank. Economic strength and moderating inflation was overshadowed by rapidly tightening credit conditions and concerns of deposit stability for regional banks, leading to the largest intervention by the Federal Reserve (Fed) since the COVID pandemic. Despite selling off throughout the first half of the month, overall equity market indices reversed intramonth declines following the Federal Reserve’s intervention to provide liquidity to regional banks. Equity returns were also driven by the prospect that the Fed may pause Fed Funds interest rate increases. Although the Fed ended up hiking the benchmark Fed Funds rate by another 25 basis points (bps) to 5.00% during their March 22nd meeting, dovish commentary from Fed chair Jay Powell indicated that this may be the last Fed Funds hike for the foreseeable future.
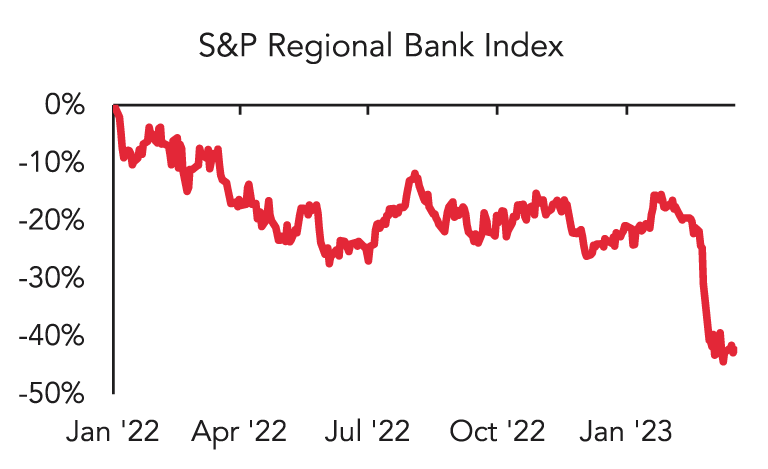
The S&P 500 Index returned 3.67% for the month, bringing year-to-date returns to 7.48%. Looking beneath the surface, regional banks faired much worse, as the S&P Regional Bank Index declined -28.16%. Bond yields declined by the largest amounts in two decades, with the two-year U.S. Treasury yield declining from 5.07% to 4.02%, and the ten-year U.S. Treasury declining from 4.05% to 3.47%.
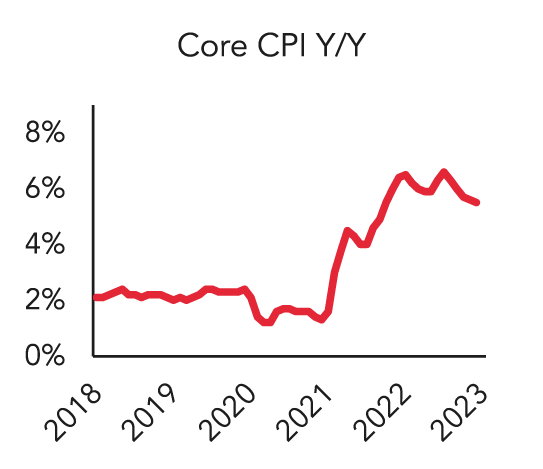
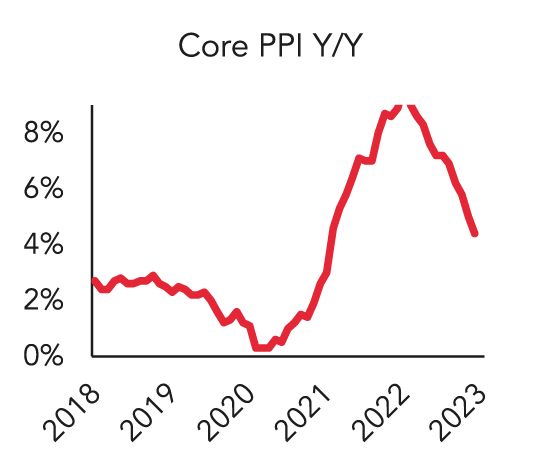
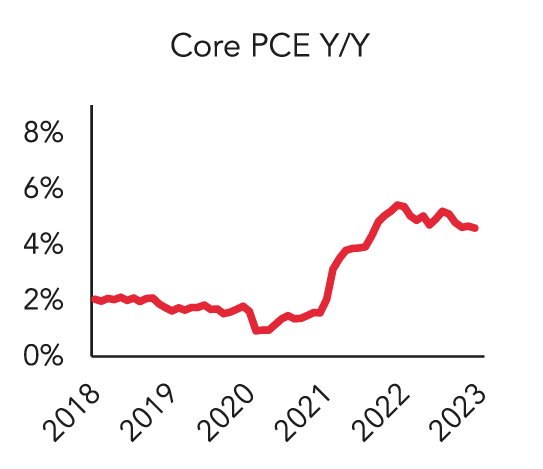
Inflation continued to soften, both relative to recent highs as well as relative to market expectations. The Core (excluding food and energy) Consumer Price Index (CPI) increased by 5.5% year-over-year (y/y)1, a continued decline relative to last September’s high of 6.6%. Other measures of inflation (which tend to lead CPI) moderated as well. The Core Producer Price Index (PPI) increased by 4.4% y/y1, and the Core Personal Consumption Expenditures (PCE) Deflator increased by 4.6% y/y2.
As with previous months, inflation continued to be driven primarily by the services sector. Decomposing the Core PCE inflation data, Core Goods inflation increased by 2.3% y/y, while Core Services increased by 5.5% y/y. However, services inflation was largely due to housing, which has a significant lag effect relative to other components of inflation. Core Services ex. Housing inflation rose by only 4.60% y/y, or 0.27% month-over-month (m/m)2. Annualizing the most recent m/m data, “run-rate” Core Services ex. Housing PCE inflation is currently running at 3.30%, close to the Federal Reserve’s long-term target.
Despite the positive inflation news, the abrupt collapse of Silicon Valley Bank (SVB) and Signature Bank sent shockwaves through the financial markets. Although SVB had relatively conservative loan underwriting and low levels of historical credit losses, it experienced a bank run on March 12-13th after an emergency attempt to raise liquidity failed, becoming the second largest bank in U.S. history to fail. SVB primarily catered towards the technology industry, and attracted over $100 billion of deposits over the last three years as cash flowed into Silicon Valley tech startups on the back of stimulative monetary policy. As deposits flowed in, SVB attempted to earn incremental yield by investing in U.S. Treasuries and mortgage-backed securities, which carry very little credit risk but do carry interest rate (duration) risk.
As interest rates rose, SVB held mark-to-market accounting losses on its treasury/MBS holdings in excess of $15 billion by the end of the year, almost in excess of its entire equity base of $16.2 billion.
In the first quarter of 2023, as the venture capital funding environment began to dry up and cash burn at startups accelerated, deposits began to flow out of the bank. Deposits continued to flee as the Federal Reserve raised interest rates, as higher yielding money market funds began to offer compelling yields relative to bank deposit interest rates. Over 85% of deposits at SVB were over the $250,000 Federal Deposit Insurance Corporation (FDIC) insured limit and the depositor base was highly concentrated, increasing the risk of deposit flight. After SVB failed to raise additional capital to shore up liquidity, prominent venture capitalists urged their portfolio companies to transfer cash out of SVB, both privately as well as via social media. This led to the largest and fastest bank run in history, as customers withdrew $42 billion in a single day, in what was described as the first “social media induced” bank run.
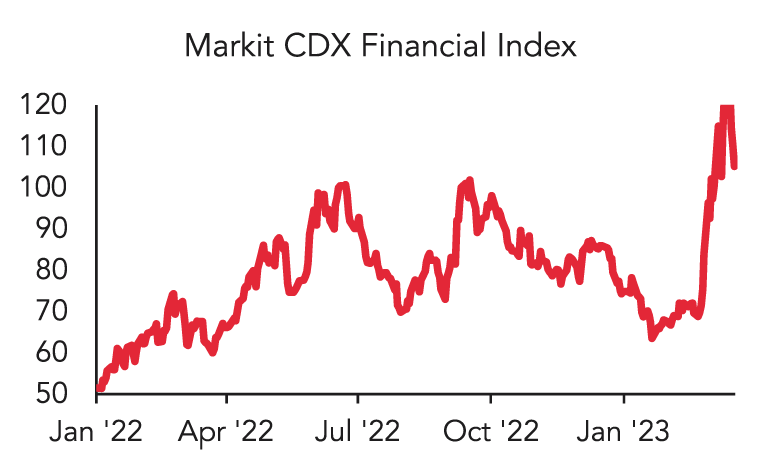
Investor concerns rapidly spread to encompass other regional banks, specifically those with high mark-to-market losses on their held-to-maturity and available-for-sale security portfolios, concentrated depositor bases, and high percentages of deposit balances over the FDIC insurance limit. The cost to insure bank debt against default spiked, with the Markit CDX North America Financial Index (an index composed of credit default swaps on major U.S. banks, which pay out when bonds default) reaching the highest level since the depths of the COVID pandemic. Regional bank stocks sold off significantly, declining by over 40% from their highs in January. Credit rating agencies downgraded many regional banks from investment grade to high yield (“junk”), while placing many others on negative credit watch3.
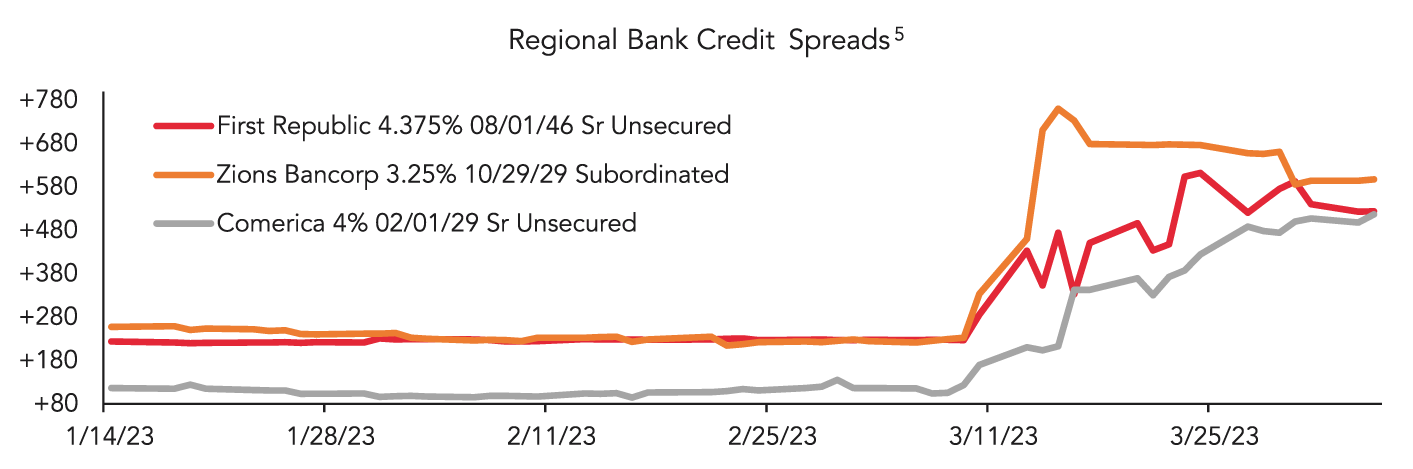
Other regional banks also saw elevated deposit withdrawals. Liquidity concerns lead investors to sell regional bank debt, resulting in credit spreads (the additional yield that investors demand versus a risk-free bond) widening to the highest levels since the 2008 financial crisis4.
Following the failure of Silicon Valley Bank, the FDIC immediately stepped in and placed the failed bank into receivership, enabling access to insured deposits. Ongoing stress in the regional banking system led to regulators to invoke the “systemic risk exemption” for SVB, allowing the FDIC to guarantee all uninsured deposits. To prevent additional bank runs, the Federal Reserve also declared that it would make additional funding available to banks to meet any liquidity needs that may arise though the creation of a new Bank Term Funding Program (BTFTP). The BTFP allows regional banks with eligible held-to-maturity and available-for-sale security portfolios to borrow against the full par amount of these holdings, preventing the need to sell securities at discounted prices to raise liquidity.
Despite the stress in the financial sector, the rest of the financial markets remained resilient. Investors sought safe havens in U.S. Treasuries and high-grade municipal bonds, driving performance of the Bloomberg U.S. Aggregate Index to 2.96% year-to-date (YTD) and the Bloomberg Municipal Bond Index to 2.78% YTD. U.S. equity performance was driven by the interest-rate sensitive technology sector, propelling the return of the S&P 500 Index to 7.48% YTD. Credit spreads widened, with investment grade corporate bond spreads6 widening to +138 basis points (bps), high yield spreads7 widening to +452 bps, residential mortgage-backed securities8 widening to +63 bps, and commercial mortgage-backed securities (CMBS)9 widening to +143 bps.
1Bureau of Labor Statistics
2Bureau of Economic Analysis
3S&P Global Ratings, Moody’s Investor Services, Fitch Ratings
4Bloomberg LP
5As of 3/31/23, Ambrus Funds held no positions in the securities mentioned
6Bloomberg U.S. Corporate Bond Index
7Bloomberg U.S. Corporate High Yield Bond Index
8Bloomberg U.S. MBS Index
9Bloomberg U.S. CMBS ERISA Eligible Index
Mutual fund investing involves risk. Principal loss is possible. Fixed income investments are subject to interest rate risk, and their value will decline as interest rates rise. Investments in fixed income securities are subject to the risks associated with debt securities generally, including credit, liquidity and interest rate risk.
Investors should consider the investment objectives, risks, charges and expenses carefully before investing. For a prospectus or summary prospectus with this and other information about the Ambrus mutual funds, please call 833-996-2101 or visit our website at AmbrusFunds.com. Read the prospectus or summary prospectus carefully before investing.
The Ambrus Funds are distributed by Foreside Funds Distributors, LLC.
Index Definitions The S&P 500 Index is a market-capitalization-weighted index of 500 leading publicly traded companies in the U.S. Bloomberg Aggregate Bond Index is a broad-based flagship benchmark that measures the investment grade, US dollar-denominated, fixed-rate taxable bond market. The index includes Treasuries, government-related and corporate securities, MBS (agency fixed-rate pass-throughs), ABS and CMBS (agency and non-agency). The Bloomberg U.S. Corporate Bond Index measures the investment grade, fixed-rate, taxable corporate bond market. It includes USD denominated securities publicly issued by US and non-US industrial, utility and financial issuers. The Bloomberg U.S. Corporate High Yield Bond Index measures the USD-denominated, high yield, fixed-rate corporate bond market. Securities are classified as high yield if the middle rating of Moody’s, Fitch and S&P is Ba1/BB+/BB+ or below. The Bloomberg Municipal Bond Index consists of a broad selection of investment-grade general obligation and revenue bonds of maturities ranging from one year to 30 years. It is an unmanaged index representative of the tax-exempt bond market, made up of all investment grade municipal bonds having a remaining maturity of at least one year. The Bloomberg Taxable Municipal Bond Index consists of a broad selection of investment grade taxable municipal bonds. The Bloomberg US Mortgage Backed Securities (MBS) Index tracks fixed-rate agency mortgag -backed pass-through securities guaranteed by Ginnie Mae (GNMA), Fannie Mae (FNMA), and Freddie Mac (FHLMC). The index is constructed by grouping individual TBA-deliverable MBS pools into aggregates or generics based on program, coupon and vintage. The Bloomberg US CMBS Index measures the investment-grade market of US Agency and US Non-Agency conduit and fusion CMBS deals with a minimum current deal size of $300mn that are ERISA eligible. Indexes are unmanaged, do not incur management fees, costs, and expenses, and it is not possible to invest directly in an index. Index performance is not indicative of fund performance. Past performance is no guarantee of future results.
Glossary Basis point (bp): one hundredth of one percent. Credit spread: also known as bond spread, or spread, measures the difference in yield between a debt security and a U.S. treasury bond of the same maturity to allow for a comparison between a bond and a risk-free (U.S. treasury) alternative. Duration measures the sensitivity of bond (and bond mutual fund) prices to interest rate movements, that considers a bond’s dollar price, coupon rate, maturity, call structure, and more. Consumer Price Index (CPI) measures the overall change in consumer prices based on a representative basket of goods and services over time. Producer Price Index (PPI) measures the average change over time in the selling prices received by domestic producers for their output. Personal Consumption Expenditures (PCE) Index measures the change in consumer prices in a wide range of consumer goods and services over time, adjusted for change in consumption preferences over time. S&P Regional Bank Index comprises stocks in the S&P Total Market Index that are classified in the GICS (Global Industry Classification Standard) regional banks sub-industry. Markit CDX North America Financial Index is an index composed of credit default swaps on 19 investment grade U.S. banks.
Credit Quality Rating Disclosures Bond ratings are grades given to bonds that indicate their credit quality as determined by private independent rating services such as Standard & Poor’s, Moody’s and Fitch. These firms evaluate a bond issuer’s financial strength, or its ability to pay a bond’s principal and interest in a timely fashion.
The views and opinions contained herein are those of the author(s) on this page, and may not necessarily represent views expressed or reflected in other Ambrus Funds communications, strategies or funds. This material is intended to be for information purposes only and is not intended as promotional material in any respect. The material is not intended as an offer or solicitation for the purchase or sale of any financial instrument. It is not intended to provide and should not be relied on for accounting, legal or tax advice, or investment recommendations. Reliance should not be placed on the views and information in this document when taking individual investment and/or strategic decisions.