Markets rallied across the board on the back of lower interest rates due to softer- than-expected inflation
Economic data was mixed, indicating an emerging deceleration in growth in the manufacturing sector, offset by ongoing strength in the service sector
China’s re-opening following restrictive zero-COVID policies led to reduced supply chain pressures
Year-to-date returns for major market indices:
S&P 500: 6.28%
Bloomberg Aggregate Bond Index: 3.08%
Bloomberg Corporate Bond Index: 4.01%
Bloomberg Municipal Bond Index: 2.87%
Market Review
Financial markets started the year with strong gains across all asset classes, including both domestic and international stocks and bonds. Performance was driven primarily by signs that inflation had begun to ease from 2022 highs, leading to speculation that central banks may be close to pausing interest rate increases. Mellowing inflation was accompanied by “good enough” economic data: good enough to offset recession concerns, yet weak enough to discourage central banks from continuing to engage in monetary tightening to slow growth. China’s re-opening following restrictive zero- COVID closure policies also supported economic growth and supply chain-related inflation pressures easing.
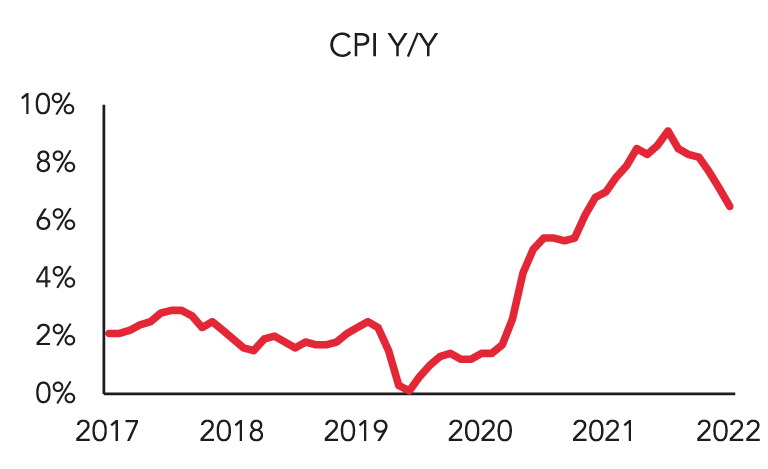
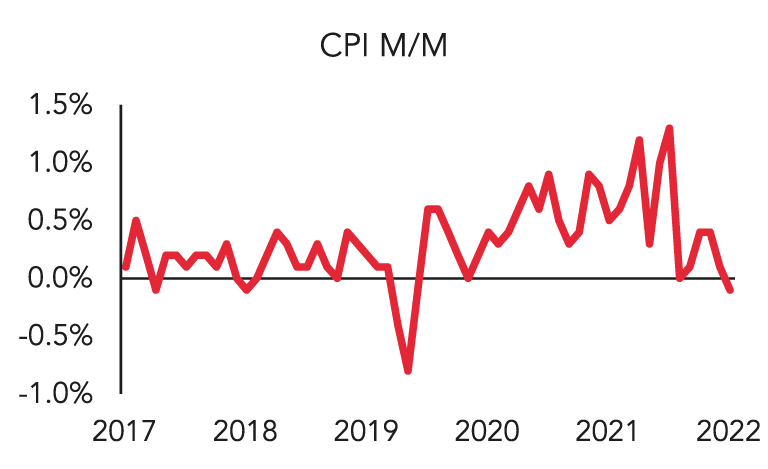
Slowing economic growth (and in the case of the manufacturing sector, declining month-over-month growth) translated to less demand for goods and services. Weaker demand, combined with international supply chain pressures easing following China’s re-opening, resulted in inflation continuing to decline from historic levels. While year- over-year headline inflation remained high, month-over-month (“run rate”) inflation cooled for the sixth consecutive month in December.
The Consumer Price Index (CPI) declined -0.1% month-over-month (m/m), bringing year-over-year (y/y) inflation to 6.5%, a continued decrease from the previous summer’s high of 9.1% y/y. Excluding the more volatile food and energy components, CPI rose by 5.7% y/y. The Producer Price Index (PPI), an inflation index more closely tied to production, rose by 5.5% y/y, with PPI excluding food and energy rising by only 5.5% y/y1.
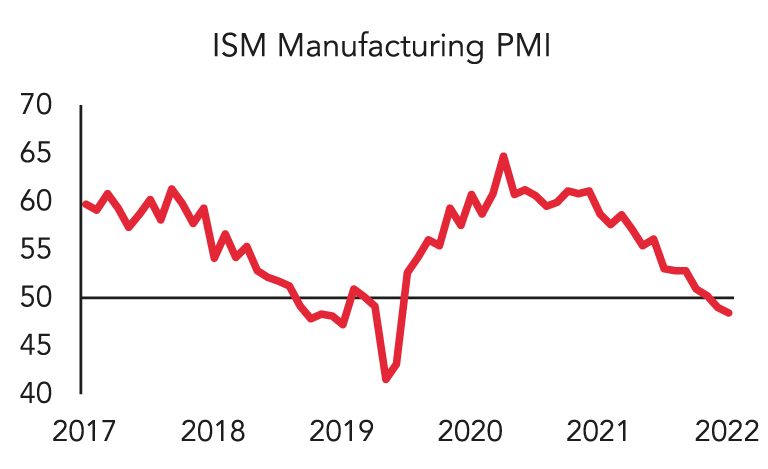
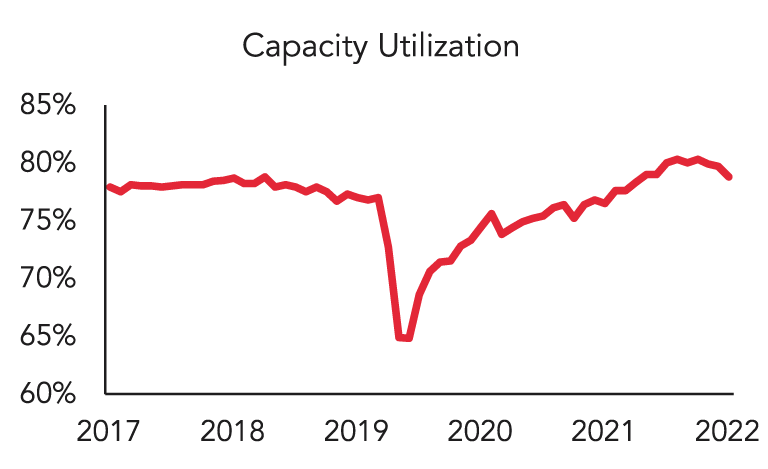
Economic data presented a mixed picture, portraying a downshift in growth from historically elevated levels. The ISM Manufacturing Purchasing Managers Index (PMI), a broad-based indicator of manufacturing activity, declined to 48.4 (readings above 50 indicate expansion, readings below 50 indicate contraction)2. The decline in manufacturing activity was also reflected in the manufacturing labor market, with the change in manufacturing payrolls increasing by only 8,000, approximately -11% less than expected3. Durable goods and capital goods new orders also decelerated to 0.10% month-over-month, half the rate of the previous month4. Factory orders declined by -1.8% month-over-month, reversing growth during the previous month and declining by more than market participants expected5. Other measures of industrial production also softened, including the Empire Manufacturing Index6, capacity utilization7, and month-over-month industrial production8.
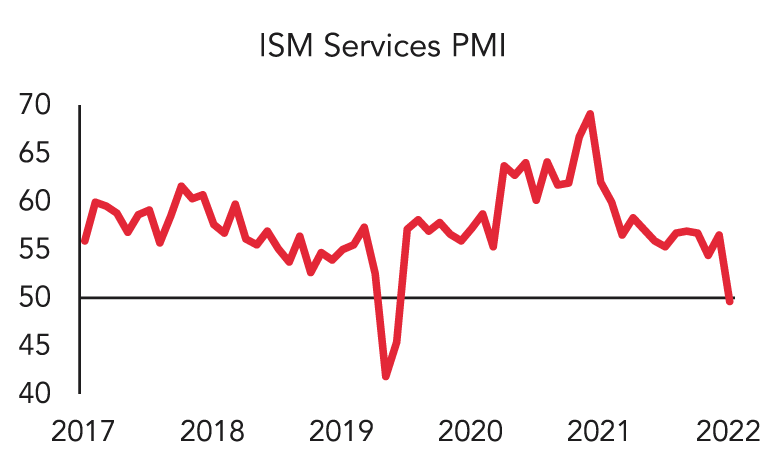
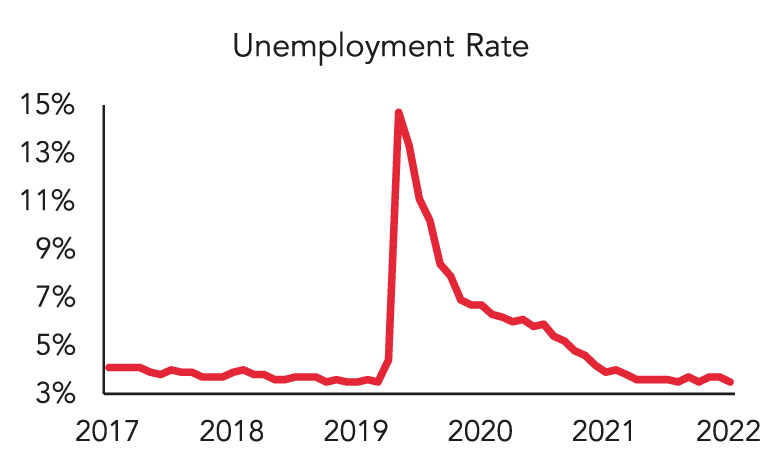
Despite the clear slowdown in the manufacturing sector, the service sector remained robust. The ISM Services Purchasing Managers Index (PMI) declined to only 49.6, indicating contraction but faring better than the manufacturing sector2. The labor markets remained strong, with fewer initial jobless claims than expected9, average hourly earnings increasing (although by less than analysts expected)10, and the unemployment rate decreasing to 3.5%11.
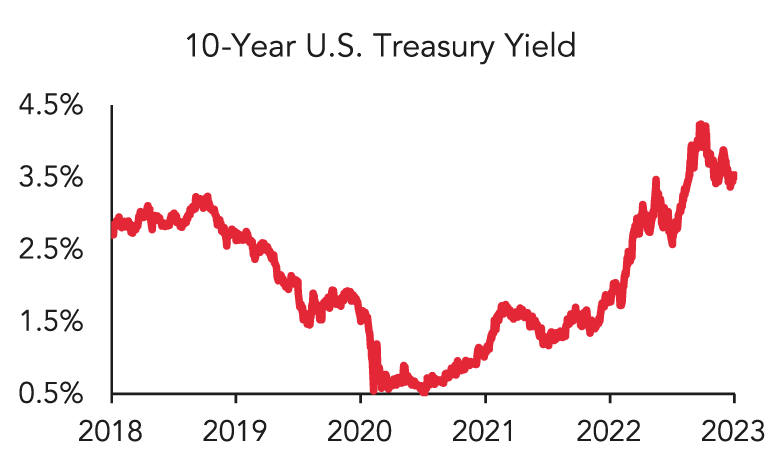
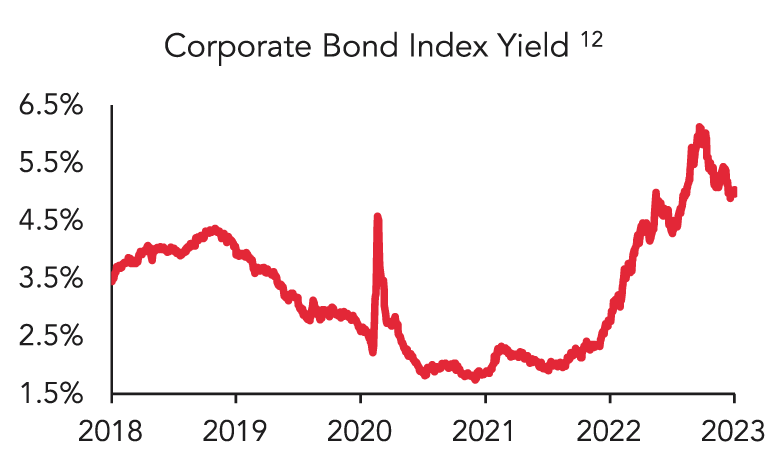
Investors took the slowdown in stride, interpreting the softening inflation and slight economic slowdown to portend a potential pause to Federal Reserve rate hikes. Bonds rallied throughout the month, with benchmark 10-year U.S. Treasury yields decreasing from 3.74% to 3.50%. Investment grade corporate bond spreads narrowed from +162 basis points (bps) to +143 bps12, while high yield corporate bond spreads narrowed from +484 bps to +445 bps13. Taxable municipal bond spreads narrowed from +127 bps to +109 bps14, and 10-year tax-exempt municipal bond ratios tightened from 71% to 63%15. Fixed-rate residential mortgage-backed securities (RMBS) tightened from +51 bps to +36 bps16, while commercial mortgage-backed securities (CMBS) declined from +116 bps to +107 bps17.
1Bureau of Labor Statistics
2Institute for Supply Management, ISM Manufacturing PMI, 48.4 actual vs 48.5 expected, ISM Services PMI, 49.6 actual vs 55.0 expected
3Bureau of Labor Statistics, US Employees on Nonfarm Payrolls Manufacturing Industry Monthly Net Change, 8k actual vs 9k expected
4U.S. Census Bureau, US Durable Goods New Orders Total ex Transportation & Capital Goods New Orders
5U.S. Census Bureau, US Manufacturers New Orders Total
6Federal Reserve Bank of New York, US Empire State Manufacturing Survey General Business Conditions, -32.9 actual vs -8.7 expected
7Federal Reserve, US Capacity Utilization % of Total Capacity SA, 78.8% actual vs. 79.5% expected
8Federal Reserve, US Industrial Production MOM, -0.7% vs -0.1% expected
9Department of Labor, US Initial Jobless Claims SA, 205k vs 215k expected
10Bureau of Labor Statistics, US Average Hourly Earnings All Employees Total Private MoM, 0.3% actual vs 0.4% expected
11Bureau of Labor Statistics, U-3 US Unemployment Rate Total in Labor Force Seasonally Adjusted
12Bloomberg U.S. Corporate Bond Index
13Bloomberg U.S. Corporate High Yield Bond Index
14Bloomberg Taxable Municipal Bond Aggregate Eligible Index
15Bloomberg 10-Year Municipal Bond Percentage of Treasury Index
16Bloomberg U.S. MBS Index
17Bloomberg U.S. CMBS ERISA Eligible Index
Mutual fund investing involves risk. Principal loss is possible. Fixed income investments are subject to interest rate risk, and their value will decline as interest rates rise. Investments in fixed income securities are subject to the risks associated with debt securities generally, including credit, liquidity and interest rate risk.
Investors should consider the investment objectives, risks, charges and expenses carefully before investing. For a prospectus or summary prospectus with this and other information about the Ambrus mutual funds, please call 833-996-2101 or visit our website at AmbrusFunds.com. Read the prospectus or summary prospectus carefully before investing.
The Ambrus Funds are distributed by Foreside Funds Distributors, LLC.
Index Definitions The S&P 500 Index is a market-capitalization-weighted index of 500 leading publicly traded companies in the U.S. Bloomberg Aggregate Bond Index is a broad-based flagship benchmark that measures the investment grade, US dollar-denominated, fixed-rate taxable bond market. The index includes Treasuries, government-related and corporate securities, MBS (agency fixed-rate pass-throughs), ABS and CMBS (agency and non-agency). The Bloomberg U.S. Corporate Bond Index measures the investment grade, fixed-rate, taxable corporate bond market. It includes USD denominated securities publicly issued by US and non-US industrial, utility and financial issuers. The Bloomberg U.S. Corporate High Yield Bond Index measures the USD-denominated, high yield, fixed-rate corporate bond market. Securities are classified as high yield if the middle rating of Moody’s, Fitch and S&P is Ba1/BB+/BB+ or below. The Bloomberg Municipal Bond Index consists of a broad selection of investment-grade general obligation and revenue bonds of maturities ranging from one year to 30 years. It is an unmanaged index representative of the tax-exempt bond market, made up of all investment grade municipal bonds having a remaining maturity of at least one year. The Bloomberg Taxable Municipal Bond Index consists of a broad selection of investment grade taxable municipal bonds. The Bloomberg US Mortgage Backed Securities (MBS) Index tracks fixed-rate agency mortgage backed pass-through securities guaranteed by Ginnie Mae (GNMA), Fannie Mae (FNMA), and Freddie Mac (FHLMC). The index is constructed by grouping individual TBA-deliverable MBS pools into aggregates or generics based on program, coupon and vintage. The Bloomberg US CMBS Index measures the investment-grade market of US Agency and US Non-Agency conduit and fusion CMBS deals with a minimum current deal size of $300mn that are ERISA eligible. Indexes are unmanaged, do not incur management fees, costs, and expenses, and it is not possible to invest directly in an index. Index performance is not indicative of fund performance. Past performance is no guarantee of future results.
Glossary Basis point (bp): one hundredth of one percent. Credit spread: also known as bond spread, or spread, measures the difference in yield between a debt security and a U.S. treasury bond of the same maturity to allow for a comparison between a bond and a risk-free (U.S. treasury) alternative. Consumer Price Index (CPI) measures the overall change in consumer prices based on a representative basket of goods and services over time. Producer Price Index (PPI) measures the average change over time in the selling prices received by domestic producers for their output. The ISM (Institute for Supply Management) Manufacturing & ISM Services Purchasing Managers Index (PMI) is based on data compiled from monthly replies to questions asked of purchasing and supply executives in over 400 industrial companies. For each of the indicators measured (New Orders, Backlog of Orders, New Export Orders, Imports, Production, Supplier Deliveries, Inventories, Customers Inventories, Employment, and Prices), this report shows the percentage reporting each response, the net difference between the number of responses in the positive economic direction and the negative economic direction and the diffusion index. The Empire Manufacturing Index is a survey given out by the Federal Reserve Bank of New York to manufacturing companies within the state of New York. It measures how the people who run these companies feel towards the economy.
Credit Quality Rating Disclosures Bond ratings are grades given to bonds that indicate their credit quality as determined by private independent rating services such as Standard & Poor’s, Moody’s and Fitch. These firms evaluate a bond issuer’s financial strength, or its ability to pay a bond’s principal and interest in a timely fashion.
The views and opinions contained herein are those of the author(s) on this page, and may not necessarily represent views expressed or reflected in other Ambrus Funds communications, strategies or funds. This material is intended to be for information purposes only and is not intended as promotional material in any respect. The material is not intended as an offer or solicitation for the purchase or sale of any financial instrument. It is not intended to provide and should not be relied on for accounting, legal or tax advice, or investment recommendations. Reliance should not be placed on the views and information in this document when taking individual investment and/or strategic decisions.